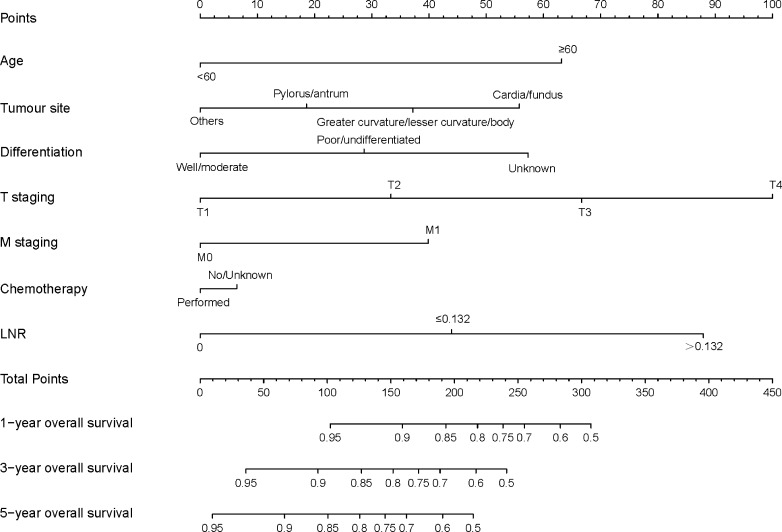
Figure 2.
Nomogram predicting the OS rates of 1, 3 and 5 years of patients with gastric neuroendocrine tumour. The nomogram summed the points identified on the scale for each variable. The total points projected on the bottom scales indicate the probabilities of OS rates of 1, 3 and 5 years. LNR, lymph node ratio; OS, overall survival.

