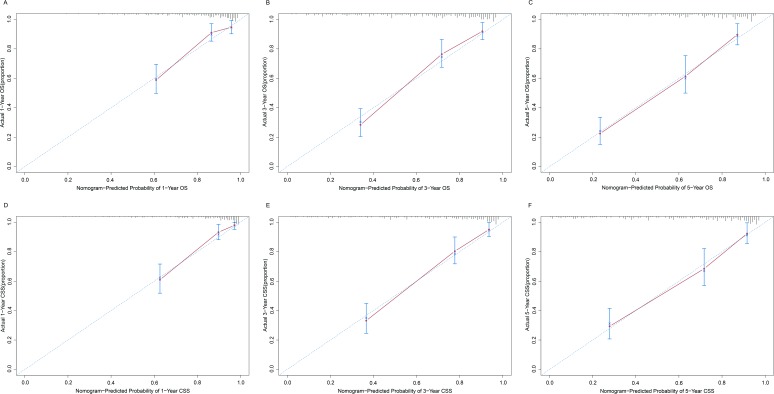
Figure 4.
Calibrations of the nomograms for predicting survival rates. The x axis represents the nomogram-predicted survival rates, whereas the y axis represents the actual survival rates. 95% CIs were measured via Kaplan-Meier analysis. All predictions lie within a 10% margin of error (within the dashed lines). (A) Calibration of the nomogram for predicting 1-year OS rate. (B) Calibration of the nomogram for predicting 3-year OS rate. (C) Calibration of the nomogram for predicting 5-year OS rate. (D) Calibration of the nomogram for predicting 1-year CSS rate. (E) Calibration of the nomogram for predicting 3-year CCS rate. (F) Calibration of the nomogram for predicting 5-year CSS rate. CSS, cancer-specific survival; OS, overall survival.

