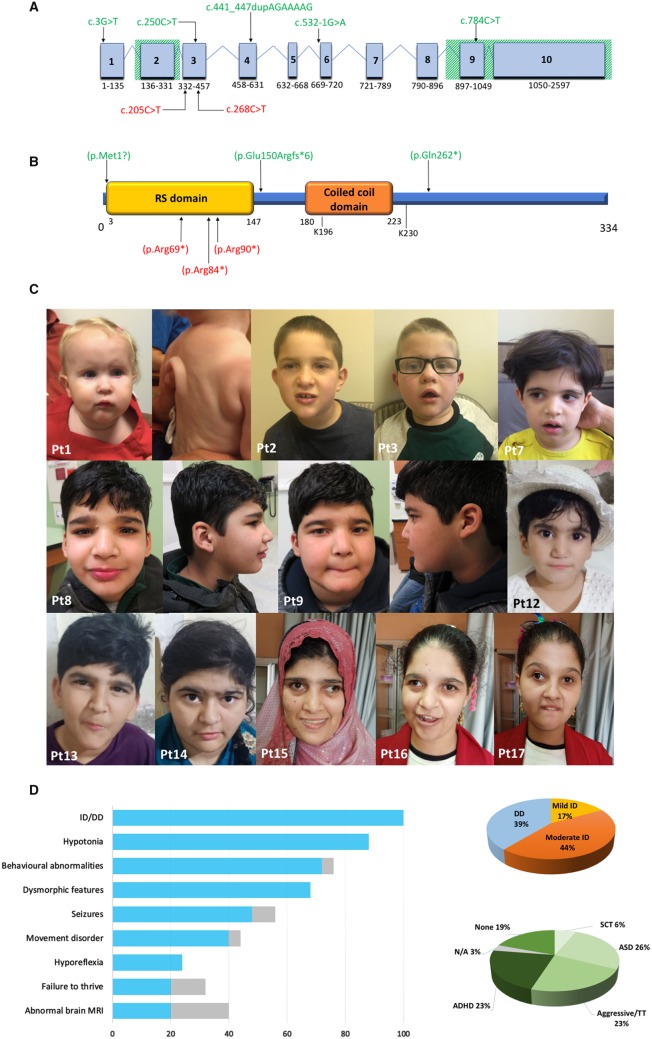
Figure 1.
Genetic findings and clinical pictures of RSRC1 patients. (A) Schematic diagram of the longer RSRC1 transcript (NM_001271838.1) consisting of 2597 nucleotides in 10 exons. The deletions encompassing exons 2 and 9–10 are represented by diagonal green lines. Single nucleotide variants are shown in red (previously reported patients) or in green (this study). (B) The RSRC1 protein (NP_001258767.1) consists of 334 amino acids encompassing an RS domain rich in arginine (R) and serine (S) that mediates the interactions with other RS-rich proteins involved in splicing regulation (SF2/ASF and U2AF35) and a coiled coil domain required for RSRC1/ERβ interaction as well as the enhancement of ERβ SUMOylation. The residues K196 and K 230 are necessary for RSRC1 SUMOylation by SUMO1 and the E3 ligases PIAS1 and PIAS3. Pathogenic amino acid changes reported in previous papers and identified in this study are shown in red and green, respectively. (C) Sequential pictures from selected patients. Patients from the Amish family (Patients 1–3) show prominent forehead, deep set eyes, depressed nasal bridge, protruding ears, and overbite with drooling. Redundant skin is evident in Patient 1. The Persian patient (Patient 7) shows straight eyebrows with mild synophrys, deep set eyes, and protruding ears. In the first Pakistani family (Patients 8 and 9) dysmorphic features include straight eyebrows with mild medial flaring, deep set eyes, wide nasal base, short philtrum, uplifted earlobes, and prominent chin. Subjects from the second Pakistani family (Patients 12–14) also show straight eyebrows with mild synophrys and deep set eyes, in addition to protruding ears with uplifted lobes (Patient 14). Patients from the Egyptian family (Patients 15–17) show thick eyebrows with medial sparing, deep set eyes, and prominent columella. (D) Graphic illustrations of the most common clinical findings in RSRC1 patients in our cohort: the bar graph shows the percent distribution of the cardinal features of RSRC1-related intellectual disability, with the grey lines representing not available data; the pie charts show the percentage distribution of developmental delay/intellectual disability and the different behavioural abnormalities observed in RSRC1 patients. Gene transcript and protein details available at: https://www.ensembl.org (RSRC1-215, transcript ID ENST00000611884.5), https://www.nextprot.org (NX_Q96IZ7), https://www.uniprot.org (Q96IZ7), https://www.proteomicsdb.org (Q96IZ7). ADHD = attention deficit hyperactivity disorder; ASD = autism spectrum disorder; DD = developmental delay; ID = intellectual disability; N/A = not available; Pt = patient; SCT = sluggish cognitive tempo; TT = temper tantrums.

