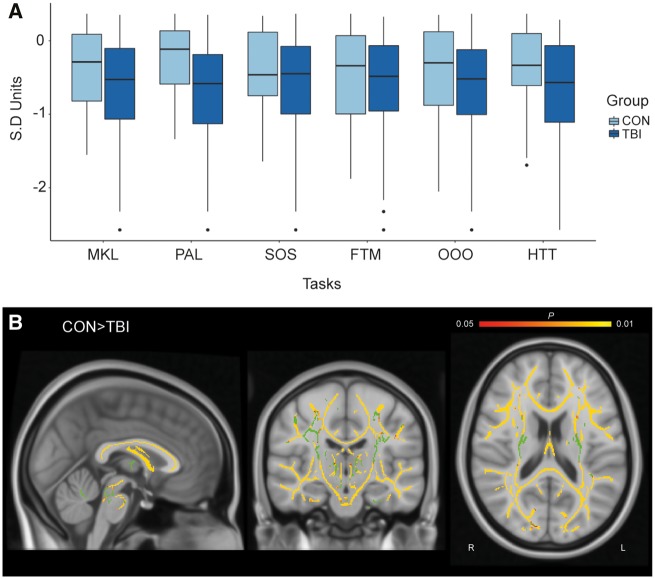
Figure 4.
Cross-sectional analysis of TBI patients and controls for cognitive performance and whole-brain fractional anisotropy. (A) Performance across the six cognitive tasks in TBI patients and healthy controls. Y-axis is in SD units. (B) Voxelwise analysis using TBSS, TFCE corrected with age as a covariate. Yellow indicates voxels with significantly higher fractional anisotropy in controls than patients (P < 0.05). Green indicates the group averaged mean fractional anisotropy skeleton mask.

