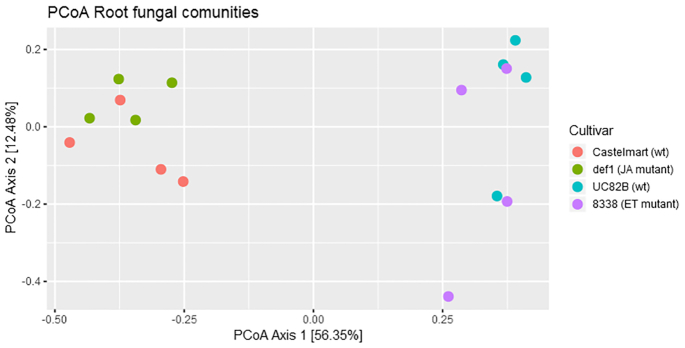
Figure 2.
PCoA of root endophytic mycobiome based on amplicon sequencing data. The sample clustering was based on the Bray–Curtis dissimilarity matrix. Each dot in the plot corresponds to a single sample (biological replication). Only genera with average relative abundance >0.5% in at least one of the genotypes were included in the analysis.

