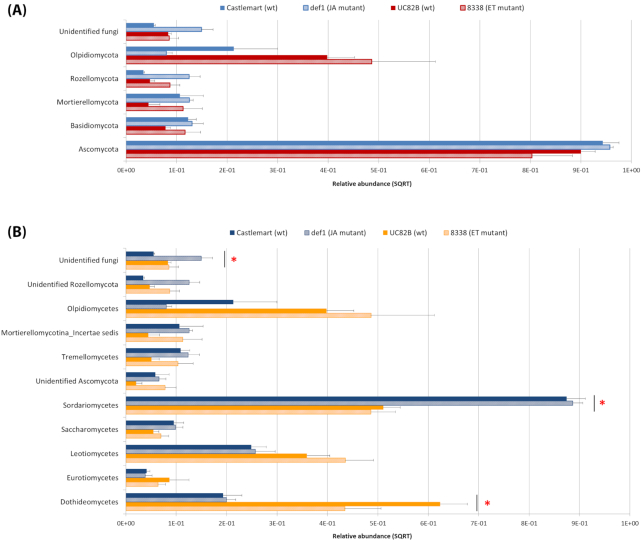
Figure 3.
Composition of the endophytic mycobiome in tomato roots at (A) phylum and (B) class level based on amplicon sequencing data. Relative abundance (SQRT-transformed) is shown as the average of the four biological replications for each of the genotypes (Castlemart, def1, UC82B and 8338). Error bars represent standard error of the mean. Only taxa with average relative abundance >0.5% in at least one of the genotypes were included. The red asterisks indicate statistically significant differences (P-value < 0.05) in the pairwise comparison between Castlemart and UC82B. P-values were adjusted using the FDR correction rate (Benjamini–Hochberg procedure).

