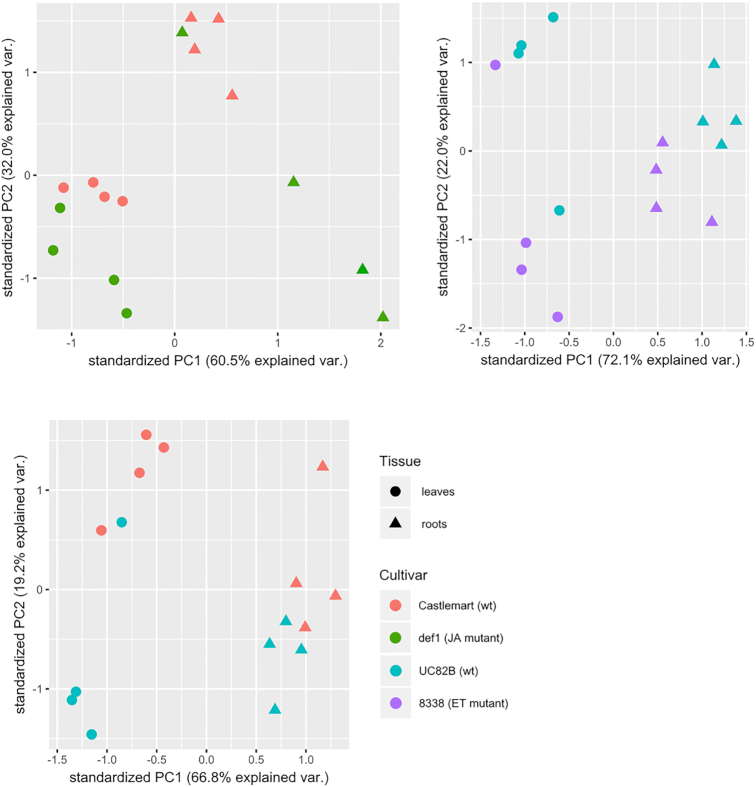
Figure 5.
PCA on the phytohormone profiles of tomato leaves and roots. PCA was computed on the SQRT-tranformed measurements (pmol mg−1) of the phytorhormones extracted from leaves and roots of the four tomato genotypes used in this study. The analysis was computed pair wise (Castlemart/def1, UC82B/8338 and Castlemart/UC82B) and in each plot the hormone measurements for both leaves and roots were included. Each dot/triangle in the plot corresponds to a single sample (biological replication).

