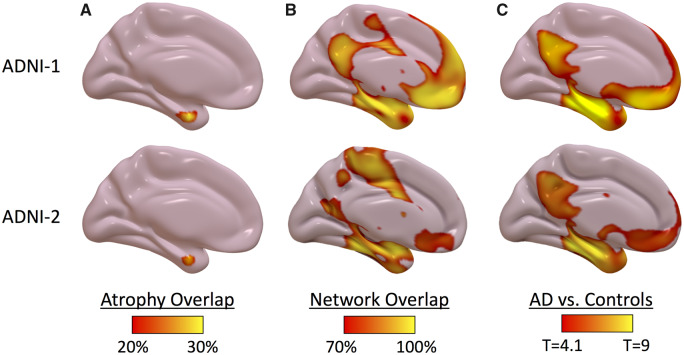
Figure 3.
Atrophy network mapping results in Alzheimer’s disease replicate across independent datasets. (A) Percentage of single-subject atrophy maps (w score < −2) overlapping in the same location. (B) Percentage of atrophy network maps (thresholded to an FWE corrected P < 0.05) overlapping in the same location. (C) Voxel-wise t-test comparing atrophy network maps in Alzheimer’s disease versus control subjects (voxel-wise FWE corrected P < 0.05). Results in discovery dataset (ADNI-1, top) are replicated in replication dataset (ADNI-2, bottom).

