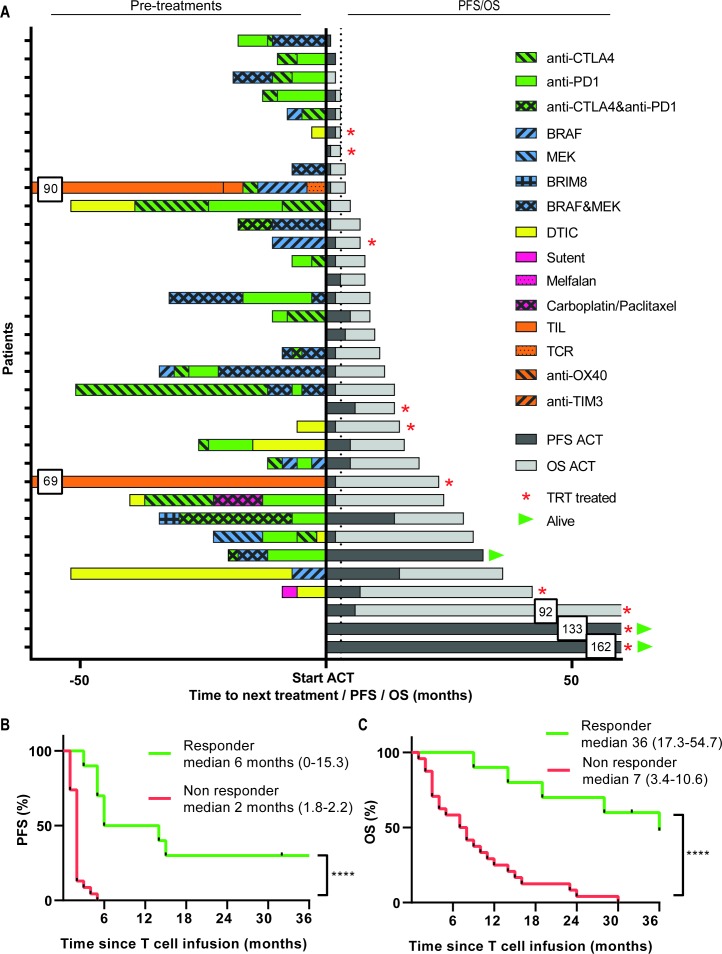
Figure 1.
Pre-treatment and survival after start of ACT treatment. (A) Treatments received before start of ACT are depicted for every individual patient in the left part, followed by their PFS and OS in months in the right part. Kaplan-Meier curves for PFS (B) and OS (C) as measured from the start of therapy for responding (R, green lines, n=10, defined as CR, PR or SD >6 months) and non-responding (NR, red lines, n=24). Differences were calculated using the log rank test, ****p<0.0001. ACT, adoptive cell therapy; CR, complete response; OS, overall survival; PFS, progression-free survival; PR, partial response; SD, stable disease.

