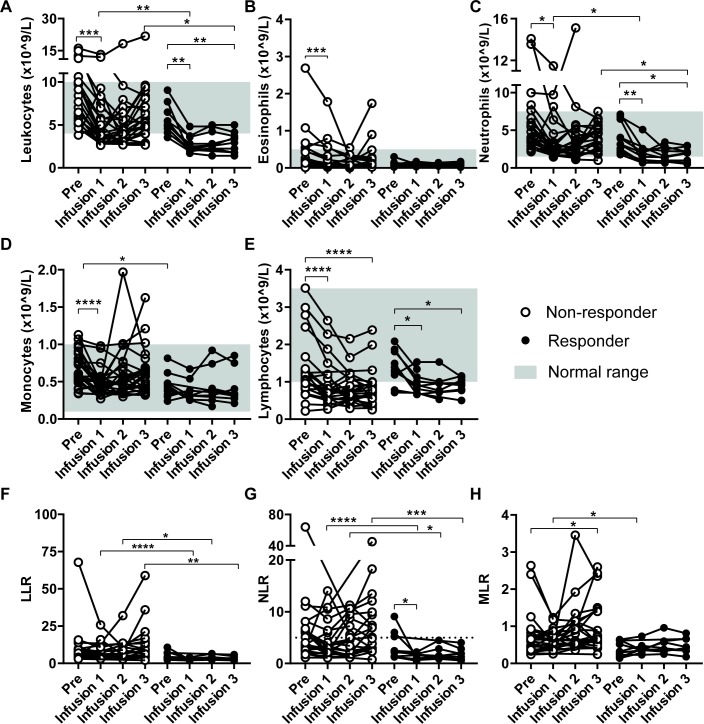
Figure 2.
Treatment effect on peripheral blood counts. Absolute blood counts were performed on peripheral blood collected at different time points: before start of IFNa treatment (Pre) and at the time of T cell infusions (Infusion 1–3) just prior to the T cell infusion. Data from non-responding patients (n=24) are compared with data from responding patients (n=10, defined as CR, PR or SD >6 months) in each panel. The absolute leukocyte (A), eosinophil (B), neutrophil (C), monocyte (D) and lymphocyte count (E) are shown. In addition, the leukocyte-tolymphocyte (LLR) (F), neutrophil-to-lymphocyte (NLR) (G) and monocyte-to-lymphocyte (MLR) (H) ratios are shown. Differences within patients were calculated using the Wilcoxon signed rank test, data between response groups were calculated using a Mann-Whitney U test, *p<0.05, **p<0.01, ***p<0.001, ****p<0.0001. CR, complete response; IFN, interferon; PR, partial response; SD, stable disease.

