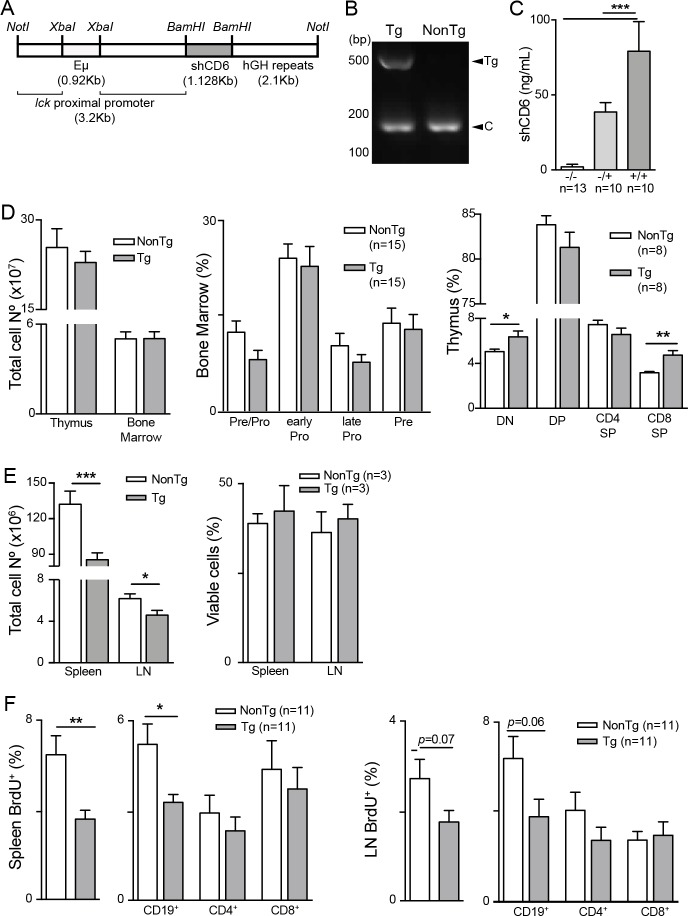
Figure 1.
Generation and immunophenotypical characterization of shCD6LckEμTg mice. (A) Schematic representation of the transgene coding for soluble human CD6 (shCD6). (B) PCR screening of genomic DNA from homozygous shCD6LckEµTg and non-transgenic (NonTg) mice. Bands correspond to transgene (Tg) and internal PCR control (C). (C) ELISA quantification of plasma shCD6 levels from NonTg (-/-), and heterozygous (-/+) and homozygous (+/+) shCD6EμLckTg (Tg) mice. Represented are cumulative data from two independent experiments, expressed as mean±SEM. ***p<0.001; two-tailed Student’s t-test. (D) Immunophenotypical characterization of primary lymphoid organs from shCD6LckEμTg mice. Left: total lymphoid cell numbers from thymus and bone marrow of shCD6LckEμTg (n=21 and n=13, respectively) and NonTg (n=15 and n=16, respectively) mice. Middle: percentage of CD24lowBP1- (pre-pro B cells), CD24+BP1- (early pro B cells), CD24+BP1+ (late pro B cells) and CD24highBP1+ (pre B cells) within gated CD43+B220+ bone marrow cells from shCD6LckEμTg and NonTg mice. Right: percentage of CD4-CD8- (DN), CD4+CD8+ (DP), CD4+CD8- (CD4SP) and CD4-CD8+ (CD8SP) thymocytes from shCD6LckEμTg and NonTg mice. Represented are cumulative data from at least two independent experiments, expressed as mean±SEM. *p<0.05; **p<0.01; two-tailed Student’s t-test. (E) Immunophenotypical characterization of secondary lymphoid organs from shCD6LckEμTg mice. Left: total lymphoid cell numbers in spleen, and lymph node (LN) from shCD6LckEμTg (n=50 and n=23, respectively) and NonTg (n=61 and n=28, respectively) mice. Right: percentage of viable cells (7AAD- AnnexinV-) from spleen and LN of shCD6LckEμTg and NonTg mice. One of two independent experiments is shown. (F) In vivo Bromodeoxyuridine (BrdU)-incorporation assays in secondary lymphoid organs from shCD6LckEμTg mice. Percentage of spleen (left) and LN (right) BrdU+ lymphoid cells represented as total cells and as cells gated on CD19+, CD4+ and CD8+. Represented are cumulative data from at least two independent experiments, expressed as mean±SEM. *p<0.05; **p<0.01; ***p<0.001; two-tailed Student’s t-test.

