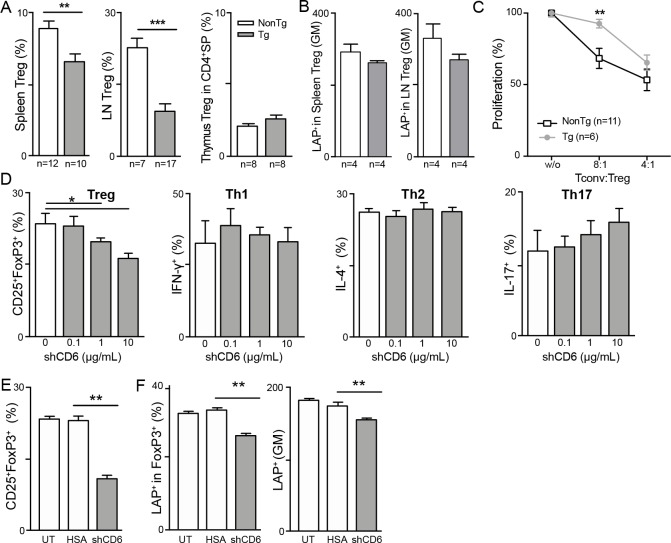
Figure 2.
Effects of soluble human CD6 (shCD6) on the frequency and functionality of Treg cells. (A) Percentage of CD25+FoxP3+ in CD4+ gated cells (Treg) from spleen, lymph node (LN) and thymus of shCD6LckEμTg and non-transgenic (NonTg) mice. (B) Geometric mean fluorescence intensity (GM) for latency-associated peptide (LAP) expression on spleen and LN Treg cells (defined as in a) from shCD6LckEμTg and NonTg mice. (C) Percentage of proliferation of CD4+CD25- (Tconv) cells from NonTg mice stimulated for 72 hours with anti-CD3 mAb plus anti-CD28 monoclonal antibody (mAb) in the absence (w/o) or presence of different ratios of CD4+CD25+ (Treg) cells from shCD6LckEμTg or NonTg mice. (D) Sorted naïve CD4+CD25-CD62LhiCD44lo splenocytes (1×10⁵) from C57BL/6J (n=5) were activated in triplicate for 72 hours with anti-CD3 (2 µg/mL) and anti-CD28 (0.5 µg/mL) mAbs under Treg, Th1, Th2, and Th17 polarization conditions, all in the presence or absence of different amounts of shCD6 (0, 0.1, 1 and 10 µg/mL). Percentage of Treg, Th1, Th2, and Th17 in CD4+ cells as deduced from intracellular FOXP3, IFN-γ, IL-4 and IL-17 co-staining, respectively, are represented as mean±SEM. **p<0.01; ***p<0.001; unpaired t-test with Welch’s correction. (E) In vitro polarized Treg cells generated as in (D) and cultured alone (UT) or in the presence of 10 µg/mL HSA or shCD6 (left) were then subjected to flow cytometry analysis for surface LAP expression. percentage (%) and geometric mean fluorescence intensity (GM) of LAP+ Treg cells is shown (middle and right, respectively). *p<0.05; **p<0.01; ***p<0.001; two-tailed Student’s t-test.

