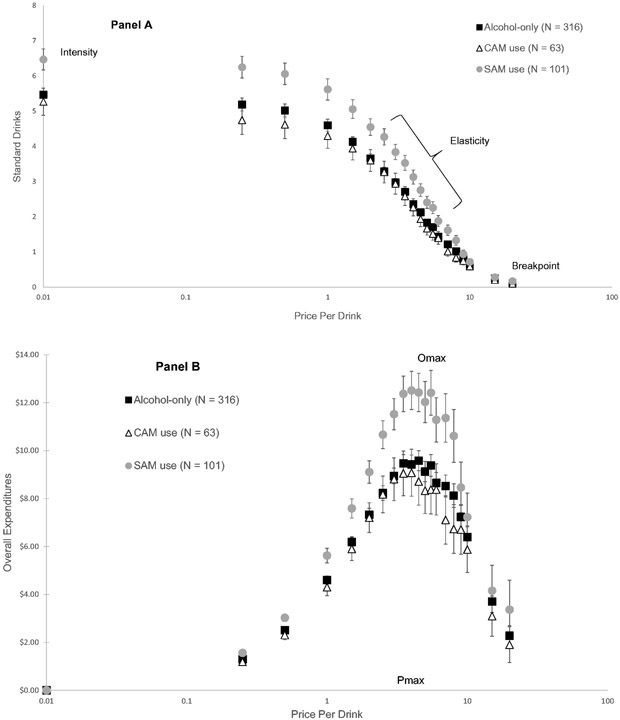
Figure 1. Alcohol Demand Curves.
Mean self-reports on the Alcohol Purchase Task plotted in double logarithmic coordinates for proportionality and shown separately for young adults that report alcohol use only (n = 316), young adults that report concurrent alcohol and marijuana use (CAM use; n = 63), and young adults that report simultaneous alcohol and marijuana use (SAM use; n = 101). Panel A shows alcohol consumption in standard drinks, and Panel B shows overall alcohol expenditures, both plotted as a function of price per drink. Error bars represent ±1 standard error of the mean.

