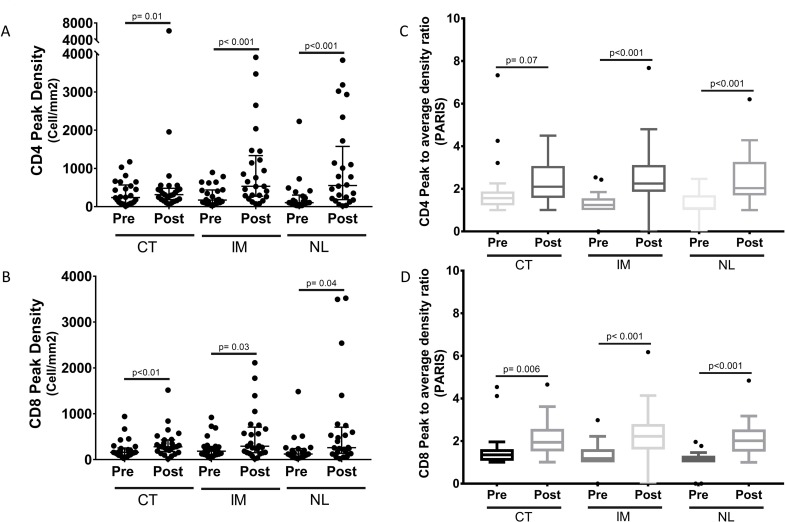
Figure 3.
Heterogeneity scores of immune-cell infiltrates within prostatic tumor immune microenvironment (TIME) in prevaccination and postvaccination sections. (A, B) CD4 and CD8 T-cell infiltrate peak densities were quantified as previously described using inForm software in each compartment before and after immunotherapy. CD4 and CD8 immune-cell density ratios were assessed by the Wilcoxon signed rank test. Median±IQR is shown with horizontal lines. (C, D) Mean PARIS scores within each compartment in both prevaccination and postvaccination sections are shown. CD4 and CD8 cell density ratios were assessed by the Wilcoxon signed rank test. CT, tumor core; IM, infiltrative margins; NL, benign lymph gland; PARIS, peak to average immune score.

