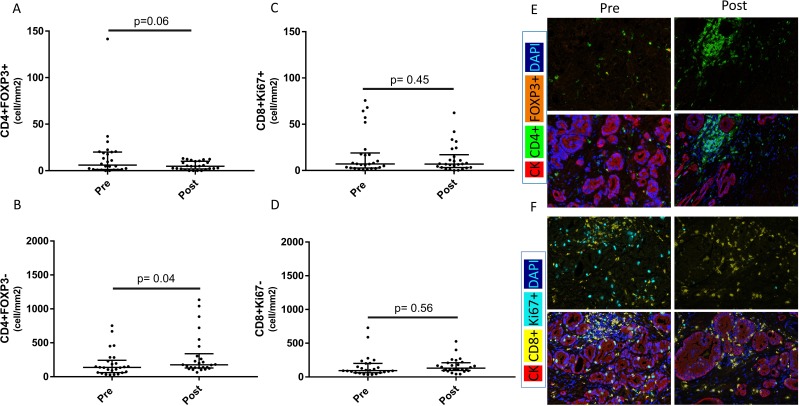
Figure 4.
Changes in immune-cell subsets within prostatic tissue before and after PROSTVAC vaccine therapy. All cell densities were quantified as previously described using inForm software. (A) Frequency of T-regulatory cells (Tregs) (CD4+FOXP3+) before and after PROSTVAC therapy in non-compartmentalized analysis (NCA). (B) Frequency of T helper cells (CD4+FOXP3–) before and after PROSTVAC therapy in NCA. (C, D) Activated (Ki67+) and non-activated (Ki67–) CD8 cytotoxic T lymphocytes were quantified using NCA in both prevaccination and postvaccination sections. For (A–D), Wilcoxon signed rank test was used. Median±IQR is shown with horizontal lines. (E, F) Representative images of all four immune-cell subsets (Tregs, T helper, activated cytotoxic T lymphocytes and non-proliferative cytotoxic T lymphocytes).

