Figure 1.

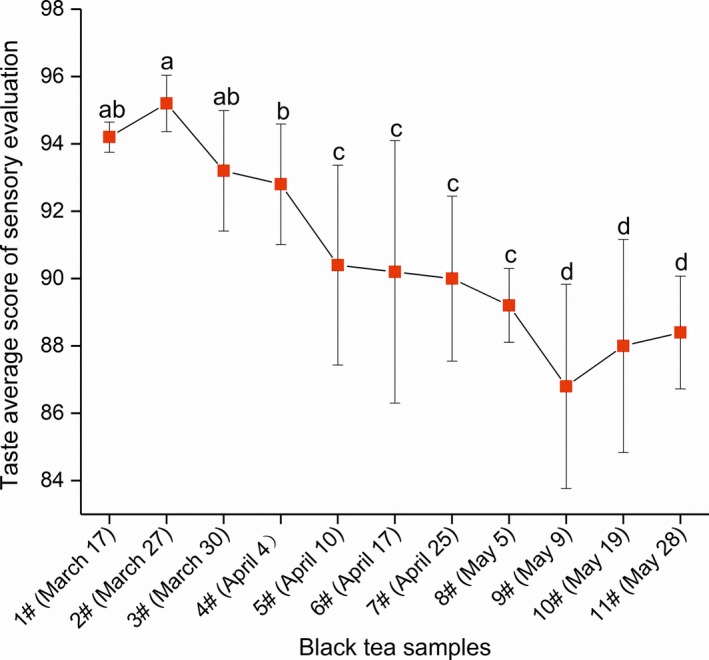
Sensory evaluation of black tea taste during a single spring season. Different lowercase letters in the figure indicate significant (p < .05) differences in the taste average score of black tea samples

Sensory evaluation of black tea taste during a single spring season. Different lowercase letters in the figure indicate significant (p < .05) differences in the taste average score of black tea samples