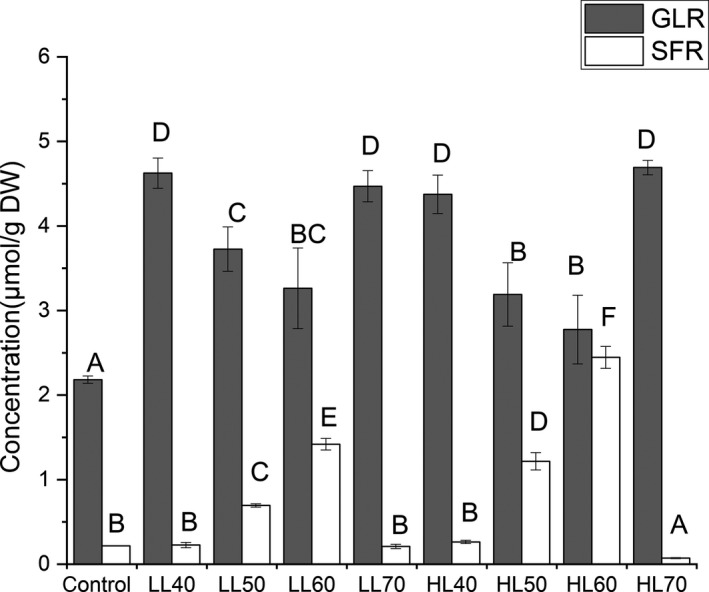
Figure 3.

The glucoraphanin (GLR) and sulforaphane (SFR) contents (μmol/g DW) in florets of broccoli during microwaving at 40, 50, 60, and 70°C using low power level (LL) or high power level (HL). Data are reported as the mean ± SD (n = 3). Values with different letters are significantly (p < .05) different
