
Figure 3.
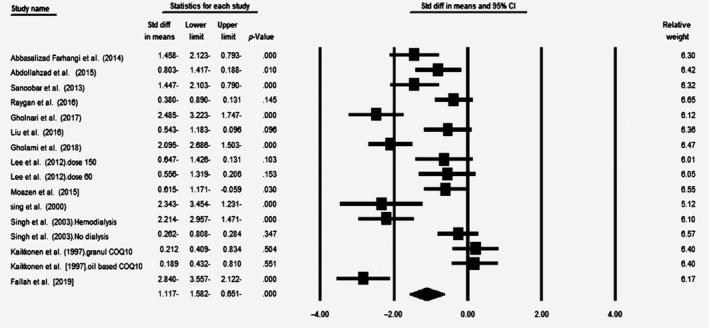
Forest plot illustrates standardized mean difference (represented by the black square) and 95% confidence interval (CI) (represented by horizontal line) for concentration of malondialdehyde (MDA) and coenzyme Q10 (CoQ10). Weights are from random‐effects analysis. The area of the black square is proportional to the specific study weight to the overall meta‐analysis. The center of the diamond displays the pool standardized mean differences, and its width shows the pooled 95% CI. Std diff, standard difference