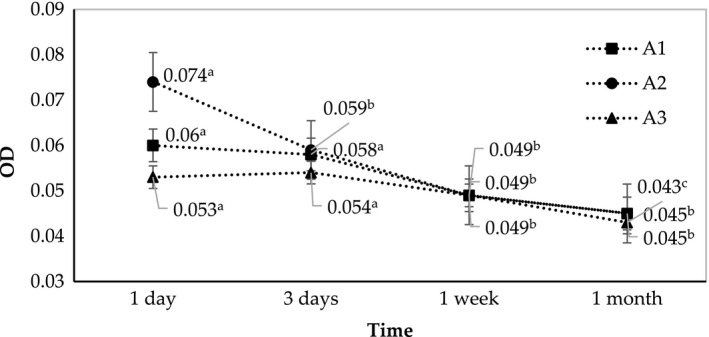
Figure 3.

Changes in optical density of A1, A2, and A3 (fabricated at SOR 2.25, 2.5, and 2.75, respectively) during one month of storage

Changes in optical density of A1, A2, and A3 (fabricated at SOR 2.25, 2.5, and 2.75, respectively) during one month of storage