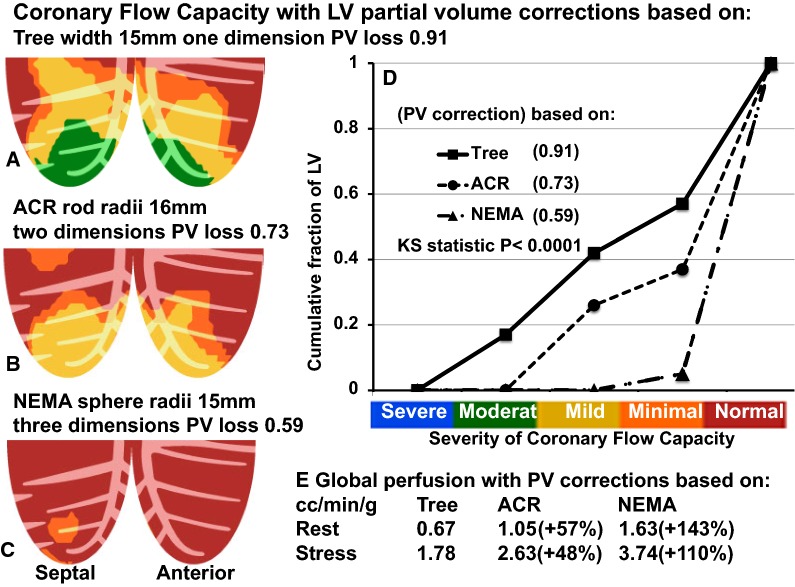
Figure 4.
Coronary Flow Capacity for one PET case with perfusion and CFC map determined using (A) standard one-dimensional PV correction (tree phantom) compared to using PV corrections derived from ACR (B) and NEMA (C) phantoms with Kolmogorov–Smirnov cumulative histogram plots and statistic (D). PV corrections derived from ACR and NEMA phantomst are expressed as percent increase over the one-dimensional PV correction derived from the tree phantom (E)

