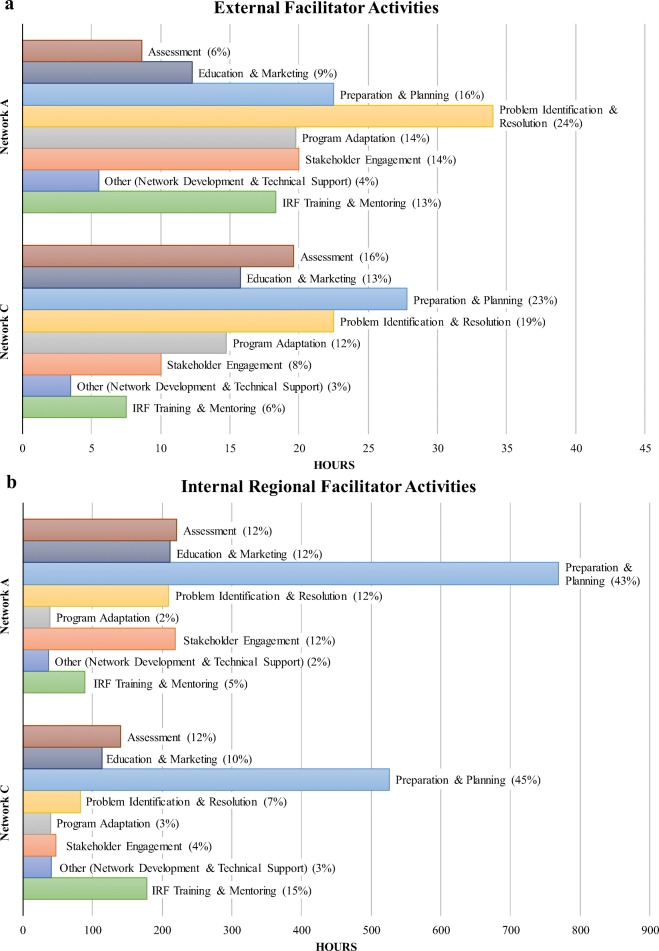
Figure 2.
Facilitator hours by primary activity. The charts above illustrate the hours and percentages of time facilitators spent on primary activities in each network. a illustrates the external facilitators’ hours and percentages of time on facilitation activities in networks A and C; b illustrates the internal regional facilitators’ hours and percentages of time.

