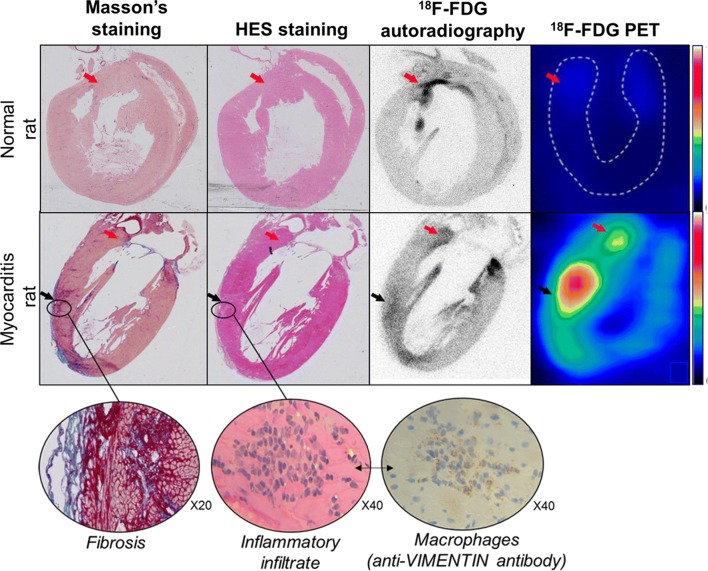
Figure 4.
Images of the left ventricle obtained through a vertical long-axis orientation in the normal rat and myocarditis rat and at the end of the 7 days of the ketogenic diet (1) with the distribution of [18F]-FDG activity obtained in vivo with the PET camera and thereafter, ex vivo at autohistoradiography, both showing the anterior and apical myocarditis areas (black arrows), as well as small areas of increased [18F]-FDG uptake in contact with the mitral annulus (red arrows), and (2) with the colocalization of fibrosis (red color with Masson’s staining) and inflammatory infiltrates (blue color with HES staining) and macrophages (brown color with antibody anti-VIMENTIN staining) on contiguous histological slices

