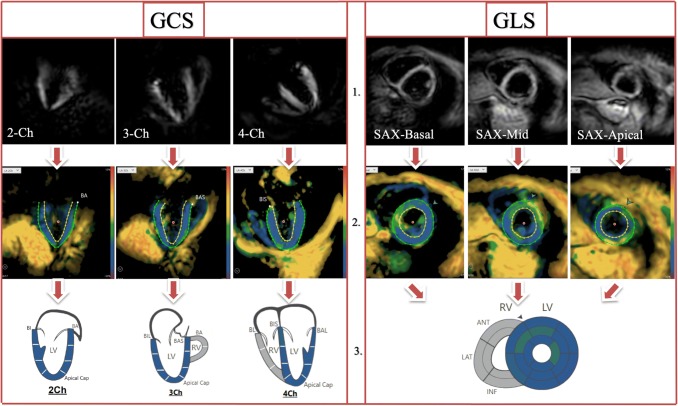
Fig. 2.
fSENC- and corresponding color-coded images after post-processing at end-systole (blue representing strain in the normal range during contraction), as well as the myocardial segmentation as illustrated by the software. Legend: 1. = Images as shown on the scanner, 2. = Color-coded images on the software after post-processing, displaying manually drawn epi-and endocardial contours at end-systole, 3. = Results of the strain analysis, represented by a color-coded map of the heart

