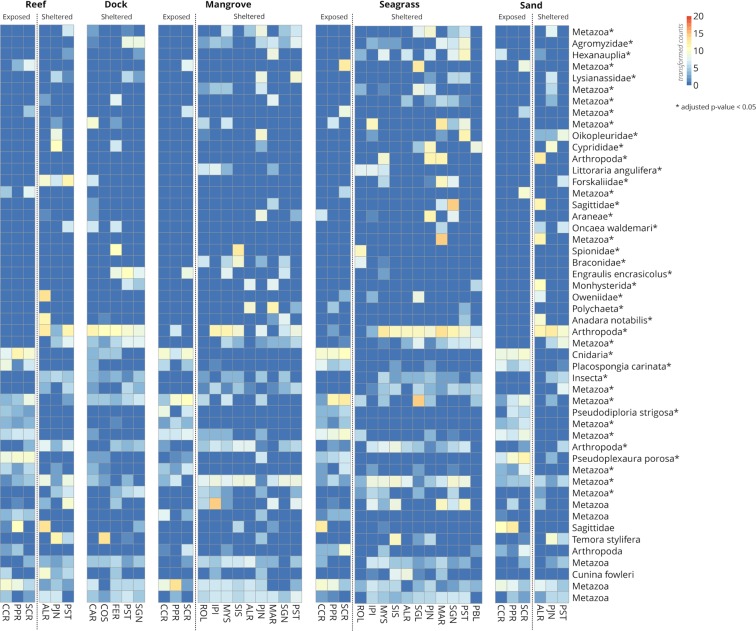
Figure 4.
Heatmaps of metazoan taxa differentially abundant in exposed and sheltered sites. The top 50 taxa are ordered top to bottom by ascending adjusted p-values (decreasing significance), with asterisks (*) denoting an adjusted p-value <0.05. The scale bar and cell colors show count values after variance stabilizing transformation. Taxa labeled as higher than species-level represent unique OTUs that could not be identified below that level. For the full names of these OTUs, refer to Supplementary File S2.

