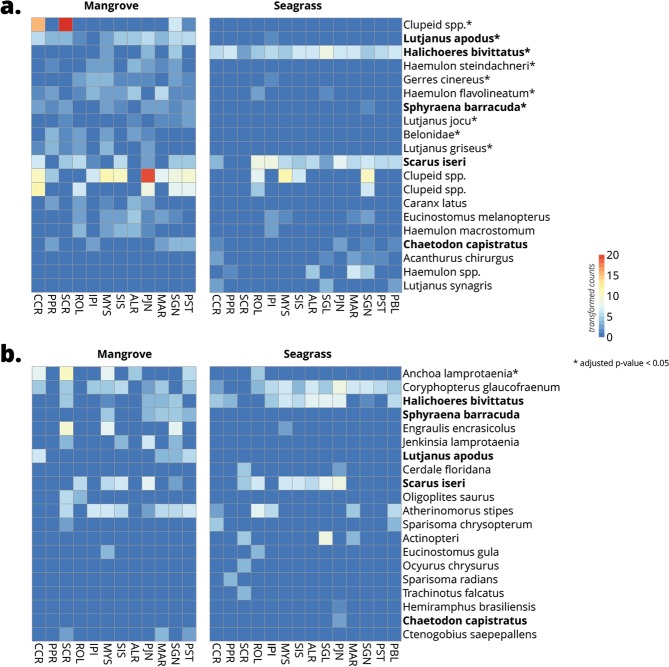
Figure 6.
Heatmaps of the top 20 bony fish taxa differentially detected in mangrove and seagrass habitats using (a) Reef Life visual fish surveys and (b) eDNA surveys. The 20 fish taxa are ordered from top to bottom by ascending adjusted p-values (decreasing significance), with asterisks (*) denoting an adjusted p-value <0.05. Bolded taxa are shared between visual and eDNA surveys. The scale bar and cell colors show count values after variance stabilizing transformation.

