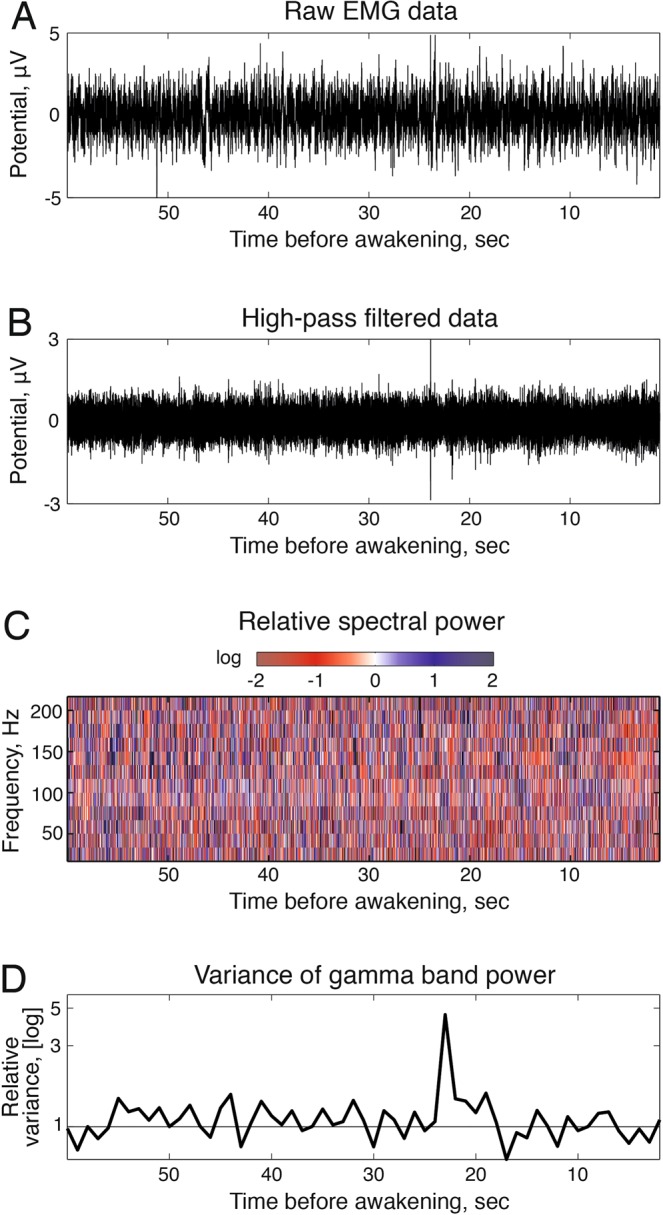
Figure 5.

Analysis of peripheral EMG activity. (A) Exemplary 60 sec EMG recording of the right hand flexoris muscle between termination of tDCS and the awakening. (B) The same EMG recording after a high-pass filter with a 50 Hz cutoff-frequency. (C) Relative spectral power of the high-pass filtered EMG recording. (D) Relative variance of gamma band power, i.e., divided by the average variance of gamma band power in the baseline time window. Values greater than one (above the grey solid line) depict 1 sec segments with a shift towards phasic EMG, values equal or smaller than one depict segments with a shift towards tonic EMG.
