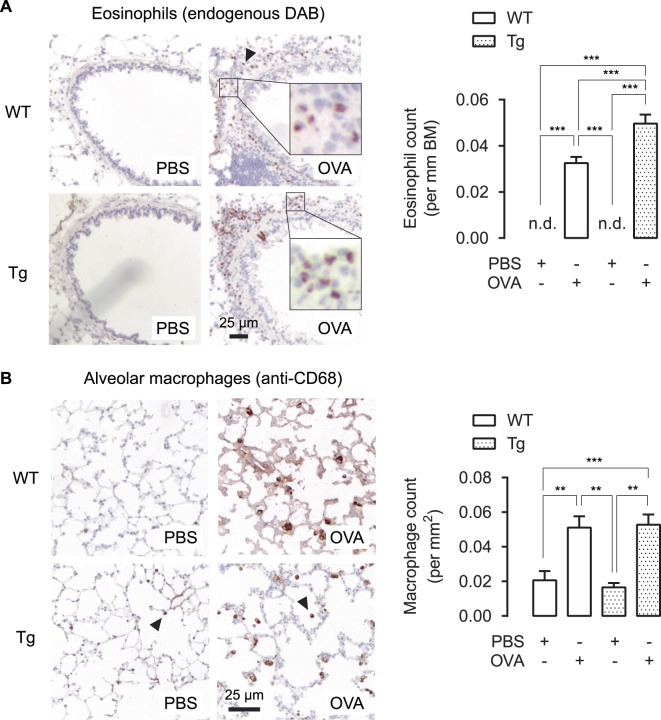
Figure 3.
Airway inflammation in OVA-treated TetO-Wnt5a;SM22-rtTA mice. (A) Representative immunohistochemistry image (left) and the quantification (right) of eosinophil’s endogenous peroxidase activity, visualized with DAB, obtained from paraffin-embedded lung tissue sections of mouse airways exposed to repeated allergen (ovalbumin) challenge vs PBS-treated controls. (B) Immunohistochemistry staining as in (A) of a CD68 antibody staining, indicative of macrophages. n.d. = not detectable. One-way ANOVA followed by Tukey’s post hoc test. Group sizes are n = 8, 8, 5, 10 for the respective groups (left to right). Data is expressed at the mean ± SEM. **p < 0.01, ***p < 0.001.

