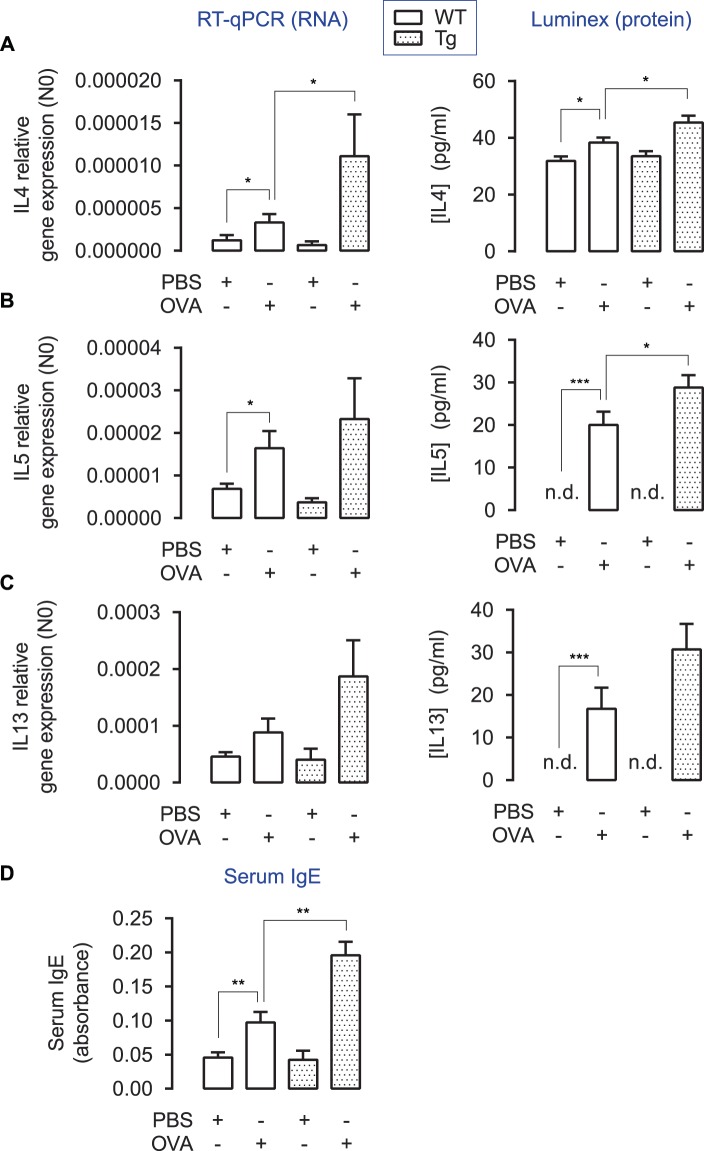
Figure 4.
Cytokine profiles in whole lung homogenates in OVA-treated TetO-Wnt5a;SM22-rtTA mice. (A/B/C) Relative gene expression (RT-qPCR, left panel) and protein levels (Luminex ELISA, right panel) of IL4 (A), IL5 (B) and IL13 (C) in whole lung homogenates of wild type (WT) and transgenic (Tg) mice exposed to repeated allergen (ovalbumin) challenge vs PBS-treated controls. *p < 0.05 **p < 0.01 ***p < 0.001 Kruskal-Wallis ANOVA on ranks followed by Dunn’s multiple comparisons test. (D) Relative total serum IgE levels in blood. n.d. = not detectable. One-way ANOVA followed by Tukey’s post hoc test. Group sizes are n = 8, 8, 5, 10 for the respective groups (left to right). Data is expressed at the mean ± SEM. *p < 0.05, **p < 0.01, ***p < 0.001.

