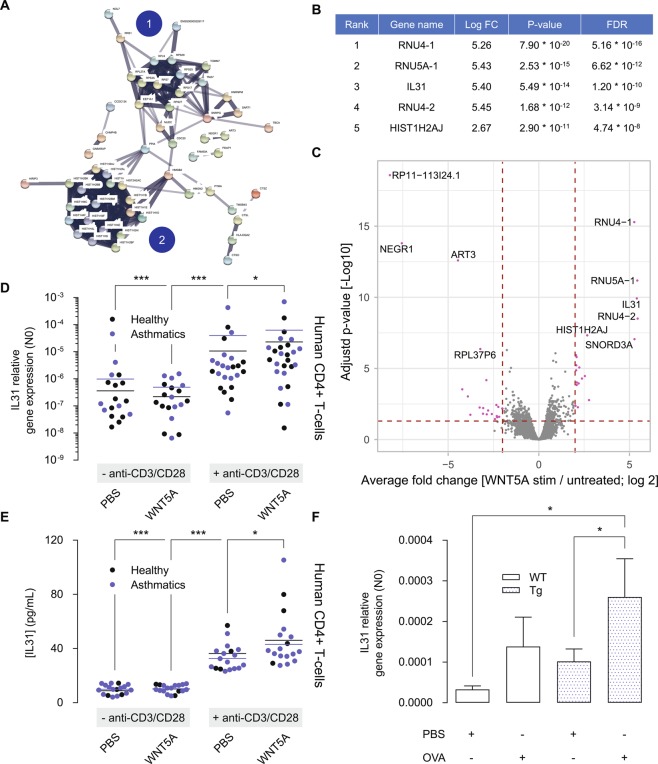
Figure 5.
WNT5A regulates gene expression of the Th2 cytokine IL31. (A) Cluster analysis of genes upregulated by WNT5A in CD4+ T cells of asthma patients. Cluster analysis was done using the StringDB online tool and identified 2 major clusters, being (1) ribosomal proteins and (2) histone proteins. (B) Top 5 most upregulated genes by WNT5A in CD4+ T cells of asthma patients. (C) Volcano plot of top regulated genes upregulated by WNT5A in CD4+ T cells of asthma patients. (D) IL31 gene expression in CD4+ T cells either left untreated (control), or treated with recombinant WNT5A, anti-CD3/anti-CD28 or its combination in asthma patients and healthy controls. Gene expression of IL31 was analysed after 24 h. Note that the y-axis has a logarithmic scale. Kruskal-Wallis ANOVA on ranks followed by Dunn’s multiple comparisons test. (E) IL31 ELISA, as in (D). (F) Relative gene expression of IL31 in whole lung homogenates. Kruskal-Wallis ANOVA on ranks followed by Dunn’s multiple comparisons test. Group sizes are n = 9, 7, 9, 7 for the respective groups (left to right). Data is expressed at the mean ± SEM. *p < 0.05, ***p < 0.001.

