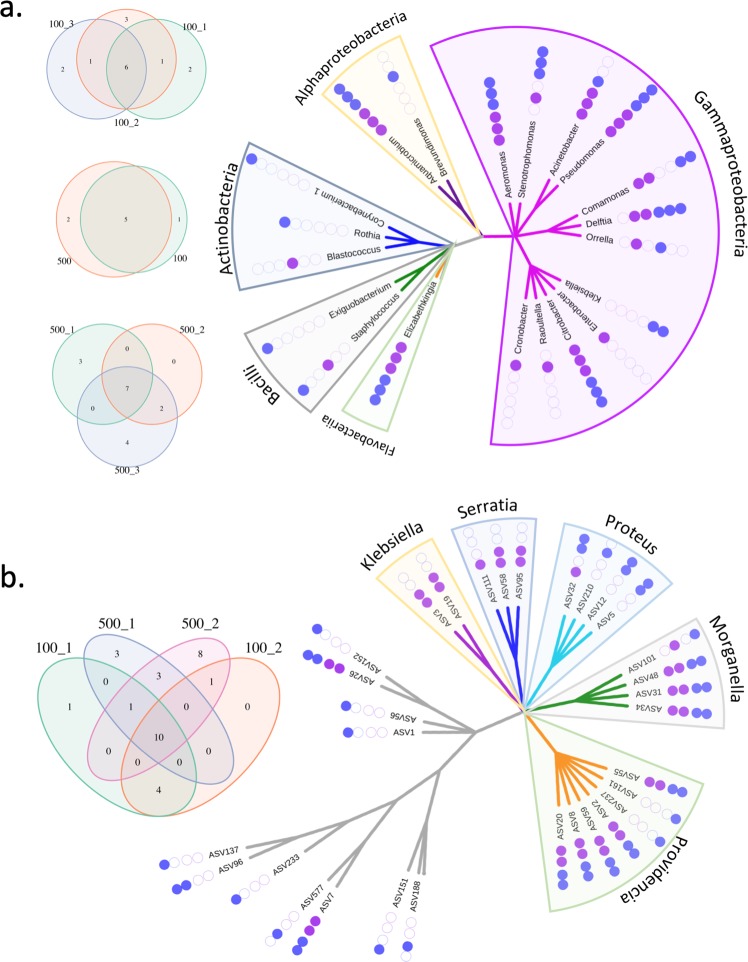
Fig. 3. Persistent genera or phylotypes at the end of the serial growth experiment.
Given the higher diversity observed in SW compared with MC, genus level results are presented for SW (a) and phylotype-level results for MC (b). Venn diagrams show the shared and unique genera/phylotypes among groups. Phylogenetic trees show all persistent genera/phylotypes. Class names are used as label for SW, while genus names in Enterobacteriales order are used for MC.

