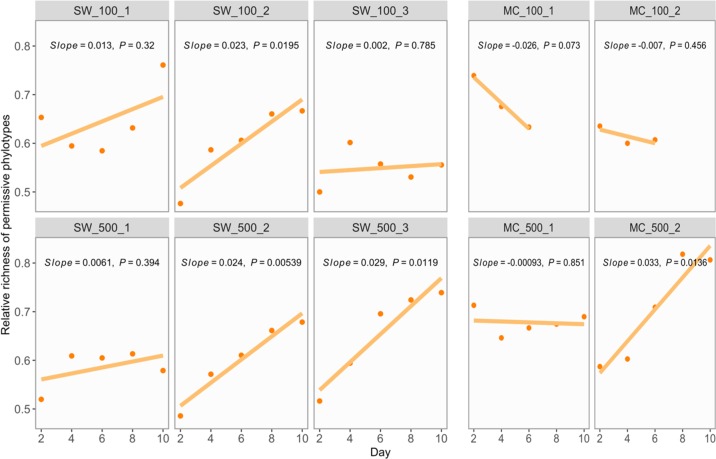
Fig. 4. Richness of permissive phylotypes relative to all recipient phylotypes over time.
A linear regression model was applied to estimate the temporal trend of the relative richness. Linear model was fitted because of the approximate linearity of most of data and because the limited number of data points made fitting more complex models irrelevant. Solid lines represent regression lines labelled with slope and P value. Positive or negative slope indicated slower or faster richness loss trends in permissive phylotypes compared with recipient phylotypes.

