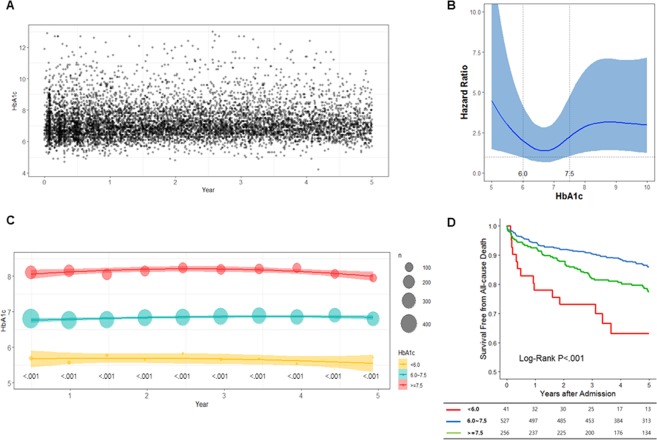
Figure 2.
Glycated hemoglobin (HbA1c) levels after acute myocardial infarction and the association of this variable with prognosis. HbA1c was measured continuously throughout the follow-up period (A). The adjusted hazard ratio according to the individual mean HbA1C level for each patient, illustrated by a J-shaped restricted cubic spline curve for all-cause mortality (B). Patients were classified into three groups according to the mean HbA1c levels: <6.0%, ≥6% to <7.5%, and ≥7.5%; each group maintained a constant HbA1c level throughout the follow-up period. The size of the circle indicates the number of patients included at each time point, and the linear lines indicate the average and standard deviation (C). The cumulative 5-year survival rate differed significantly between the three groups (D).

