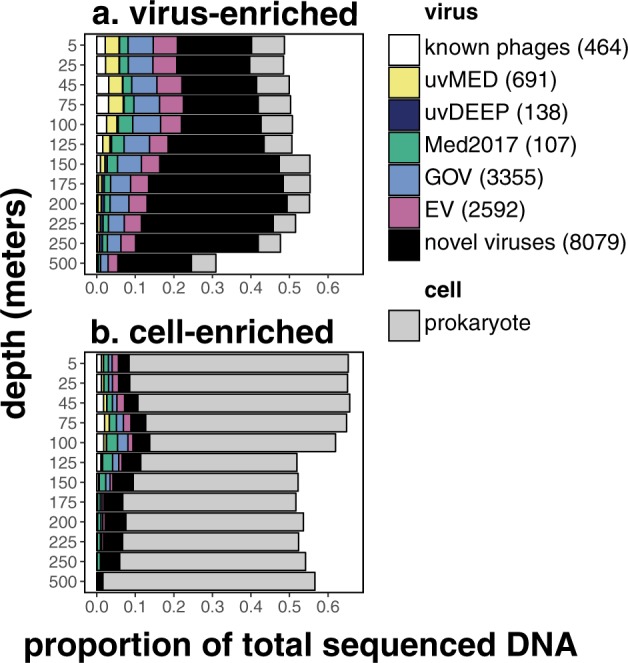
Fig. 1. Depth profiles of time-averaged viral and prokaryotic contributions to total sequenced DNA.

in a virus-enriched and b cell-enriched size fractions. Relative abundances of viral populations are colored by average amino acid identity (AAI) (>60% AAI across >50% genes) to known phages in RefSeq, and five other viral metagenomic datasets: uvMED [50], uvDEEP [23], Med2017 [24], GOV [15], and EV [16]. Legend shows number of populations identified in each category.
