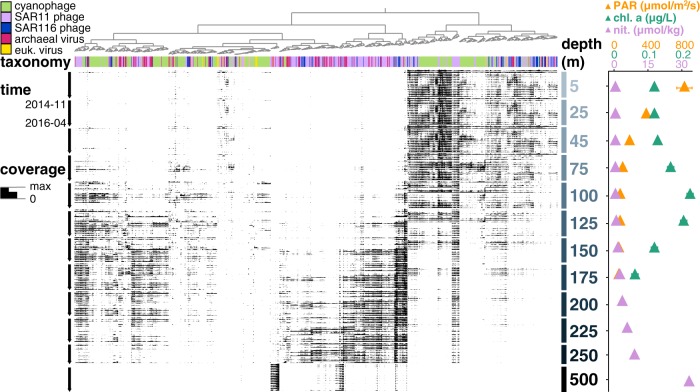
Fig. 3. Spatiotemporal distributions of annotated virus populations present in the virus-enriched size fraction.
Each node on the top dendrogram and its associated column represents the coverage profile of one virus population, colored by its corresponding taxonomic annotation. Rows represent individual samples that are horizontally ordered by depth and time. The height of the black bar in every sample shows mean interquartile range (IQR) coverage of every population, normalized to the maximum IQR coverage in that sample. Time-averaged depth profiles (mean ± SE) of environmental variables of photosynthetically active radiation (PAR), fluorometric chlorophyll a, and inorganic nitrogen are shown in colored triangles on the right panel (data retrieved from Hawaii Ocean Time-Series HOT-DOGS application).

