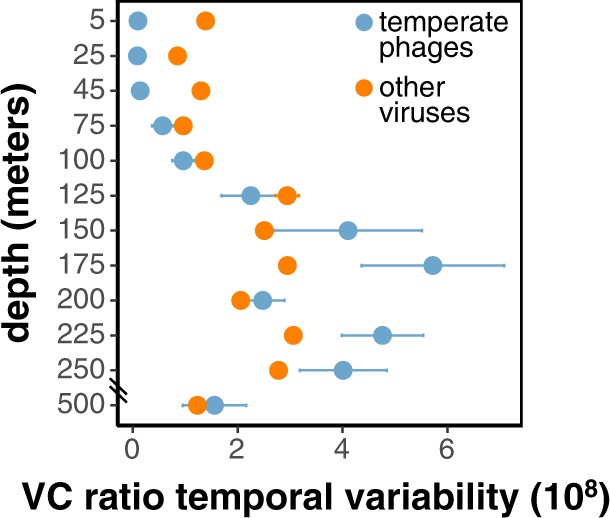
Fig. 5. Depth profiles of temporal variabilities of VC ratios (mean ± SE) of 1352 inferred temperate phages (blue) and other viral populations (orange).

Higher VC ratio temporal variability indicates episodic production of free viral particles, while lower variability indicates consistent production of free viral particles. Temporal variability of VC ratios is calculated for each population by pooling its VC ratios within each depth to determine the mean-normalized variance.
