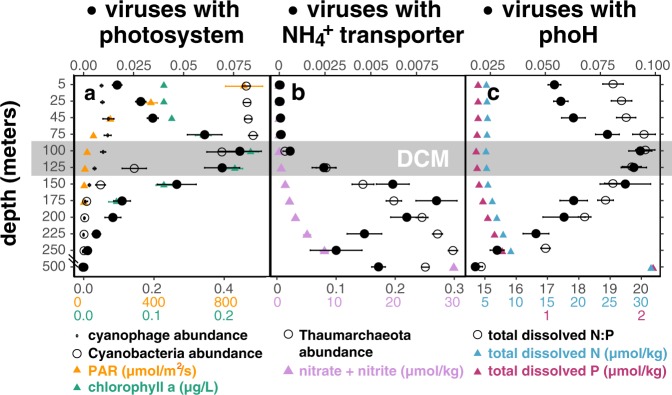
Fig. 6. Distribution of viruses containing specific auxiliary metabolic genes (AMGs) in the water column.
Solid circles show depth profiles, averaged through time (mean ± SE), of the abundance-normalized proportion of virus populations carrying auxiliary metabolic genes respectively for carbon, nitrogen, and phosphorus metabolism: a photosystem, b ammonium transporter, and c phoH. Time-averaged depth profiles of the following are included for environmental context: a relative abundances of cyanophages in the virus-enriched fraction (small open circles) and of cyanobacteria in the cell-enriched fraction (large open circles), photosynthetically active radiation (PAR) (yellow triangles), and fluorometric chlorophyll a (green triangles); b Thaumarchaeal relative abundance in the cell-enriched fraction (open circles) and inorganic nitrogen concentrations (purple triangles). c. total dissolved nitrogen (blue triangles), phosphorus (red triangles), and their ratio (open circles). Environmental metadata were retrieved from Hawaii Ocean Time-Series HOT-DOGs application. Gray box highlights depths around the deep chlorophyll maximum (DCM).

