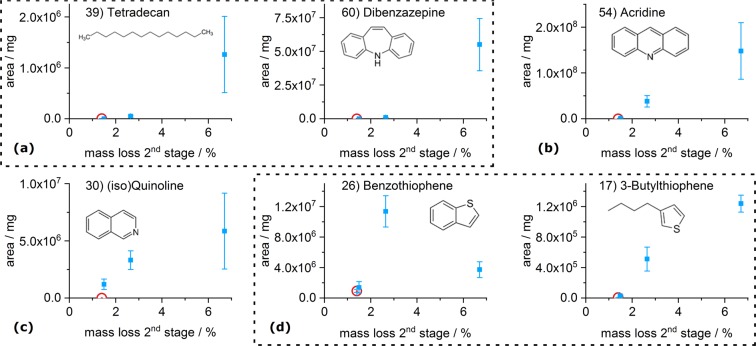
Figure 6.
Selected evolved decomposition products of the unloaded SAE Super (red circle) and its systems with varying amounts of adsorbed carbamazepine, represented by the 2nd stage’s mass loss. Types of release curves are shown for (a) starting at higher loadings, (b) continuously increasing, (c) limited at high loadings and (d) connected releases, due to hydration at high loadings. Values are normalised to sample mass. Error bars representing the range of the duplicate determination.

