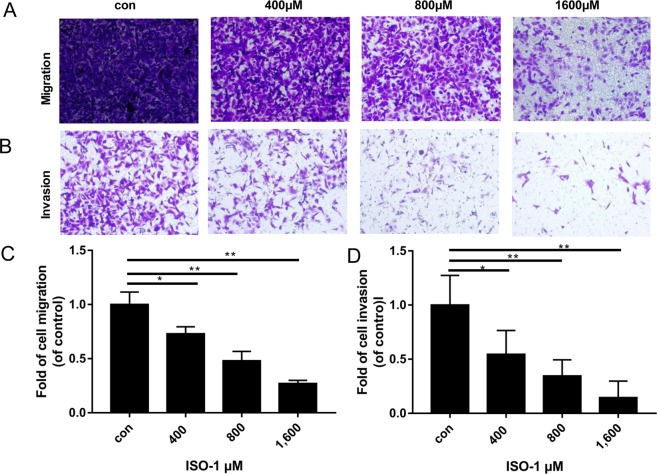
Figure 4.
Attenuation of directional migration and invasion of PANC-1 cells following ISO-1 treatment. Representative phase contrast of crystal violet stained PANC-1 cells that (A) migrated through the transwell membrane or (B) invaded through the Matrigel Matrix after 24 hours of ISO-1 treatment (magnification 200×). (C,D) Quantitative analysis of PANC-1 cell migration and invasion respectively, expressed as fold change relative to untreated controls. Graphs are presented as the mean ± SD from 3 independent experiments; *p < 0.05, **p < 0.01 when compared with untreated controls.

