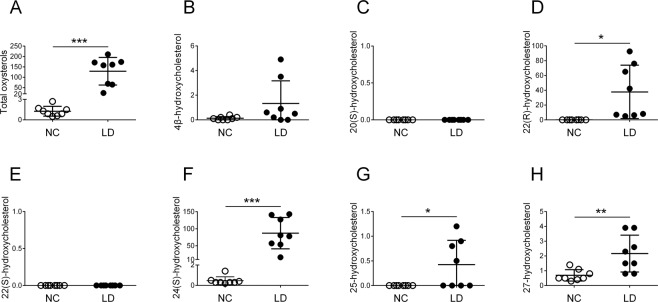
Figure 3.
Urinary oxysterols in normal controls and children with liver disease according to an enzymatic hydrolysis method. Horizontal lines represent means; vertical bars are standard deviations. Units are μmol/mol creatinine. (A) total oxysterols, (B) 4β-hydroxycholesterol, (C) 20(S)-hydroxycholesterol, (D) 22(R)-hydroxycholesterol, (E) 22(S)-hydroxycholesterol, (F) 24(S)-hydroxycholesterol, (G) 25-hydroxycholesterol, and (H) 27-hydroxycholesterol. NC, normal controls; LD, children with liver disease. *P < 0.05; **P < 0.01; ***P < 0.001.

