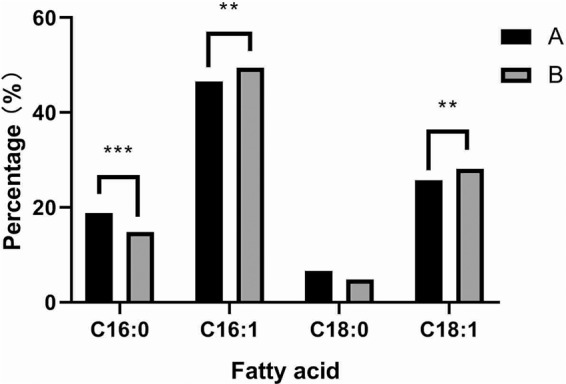
Figure 7.

Fatty acid profiles in the membrane of yeast cells. S. cerevisiae yeast strains AWRI R2 were cultivated statically at 28 °C for 72 h with (grey bars) or without (dark bars) the treatment of PAs. And then membrane fatty acid compositions were measured. Data were shown as the mean ± S.D. of three independent experiments. Two-way ANOVA with Tukey’s multiple comparisons test were used for the significant analysis at *p < 0.05, **p < 0.01, ***p < 0.001 level.
