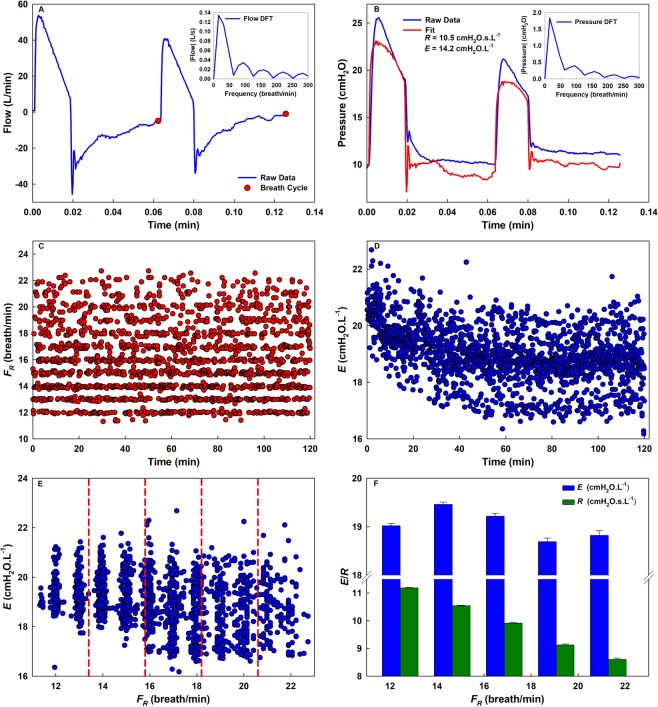
Figure 1.
The ZVV approach. Airway opening flow (A) and pressure (B) time series of two consecutive cycles with different VT’s from a patient. Notice that the two breaths are different due to the statistically defined pattern of breaths in VV. The flow is used to detect breath cycles as shown in the 2nd cycle flow data (red solid circles). The corresponding Discrete Fourier Transforms (DFTs) are shown in the insets. Using the transforms, R and E are computed from the complex ratio of pressure and flow, Z, as the real part and −2πFR times the imaginary part, respectively. The pressure fit tracing is also plotted (red line). (C) FR and (D) E for every breath as a function of time. (E) E plotted as a function of FR can be divided into five equally-spaced frequency intervals separated by red dashed lines and (F) binned into histograms showing the mean and standard error at every bin center. Similarly, R is binned as a function of FR. (D) shows a decrease in E with time, while (F) shows that E is mainly constant unlike R which decreases with frequency.

