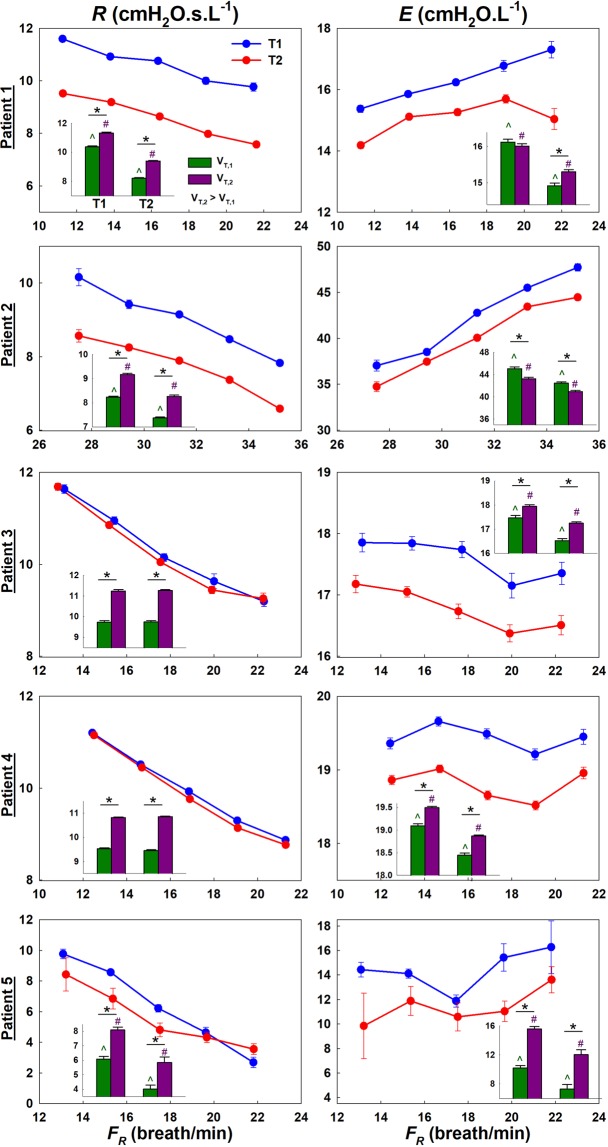
Figure 2.
Human ZVV analysis results showing the binned means and standard errors of R and E as a function of FR (solid lines) and VT (bar chart insets) for both the first and second halves of the time recording (T1 and T2). Notice that the lowest FR in patient 2 was greater than the highest FR in all other patients. Note also that the error bars are often smaller than the symbols. (*): significance between VT within same T. (^) and (#): significance from T1 to T2 for VT,1 and VT,2 (VT,2 > VT,1).

