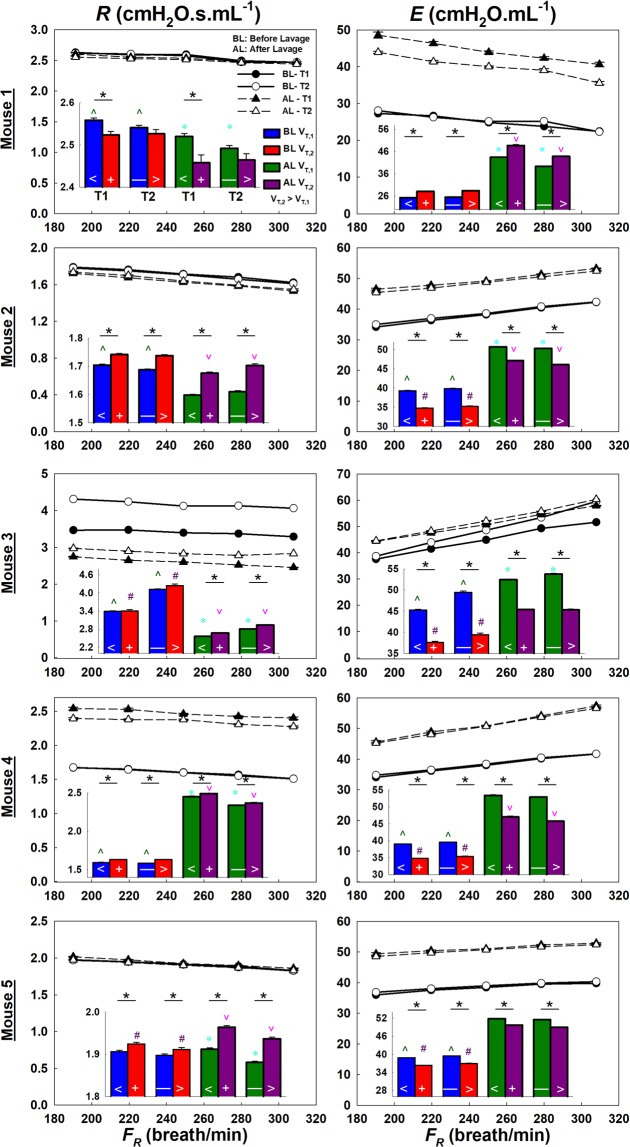
Figure 3.
Mouse ZVV analysis results showing the means and standard errors of R and E as a function of FR and VT (bar charts insets) for T1 and T2 before (solid lines) and after (dashed lines) lavage. With respect to FR, R showed a decrease in all mice, while E increased in 4 out of 5 mice before and after lavage. With respect to VT, expect for mouse 1, R increased while E decreased significantly with increasing VT both in T1 and T2 before and after lavage. Following lavage, E increased in all mice while R was subject specific either decreasing or increasing. However, the effect of T on E before and after lavage was different (Supplementary Table S3). Although the percent changes were small (<10%), they were statistically significant in 4 out of 5 mice. (*): Significance between VT within same T. (^) and (#): significance between T1 and T2 for VT,1 and VT,2 before lavage. (*) and (^): significance between T1 and T2 for VT,1 and VT,2 after lavage. (<) and (+): significance before and after lavage during T1 for VT,1 and VT,2. (—) and (>): significance before and after lavage during T2 for VT,1 and VT,2.

