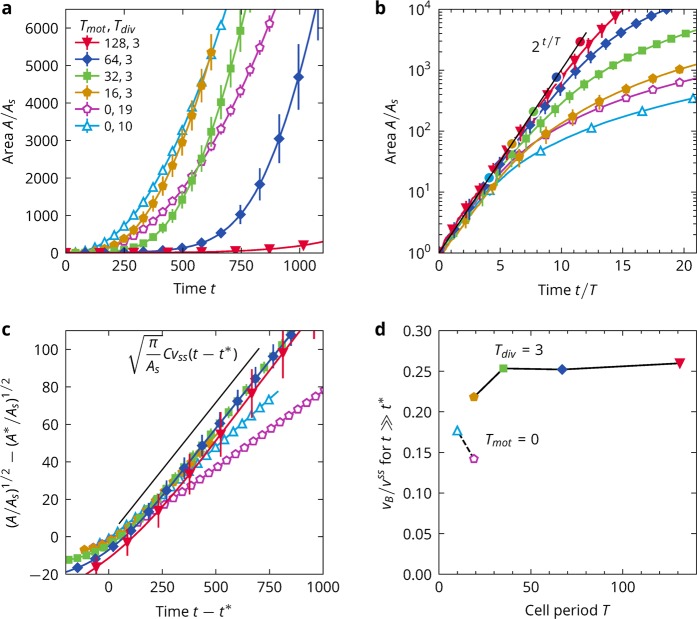
Figure 4.
Variation in the cell cycle. (a) Area of the colony for a range of against time. Error bars calculated from the standard deviation of colony sizes for the independent simulation runs are marked as vertical lines at regular intervals. (b) Area of the colony for a range of against rescaled time. The black line marks the exponential growth expected for when all cell division attempts are successful, Eq. (4). The coloured circles mark the estimates for the crossover time and crossover colony size , as determined from Eqs. (6) and (8). The simulations with and 0, 19 share the same crossover. (c) Scaling plot to expose linear long-time growth. The black line gives the asymptote of Eq. (10). (d) Boundary speed against the cell cycle period .

