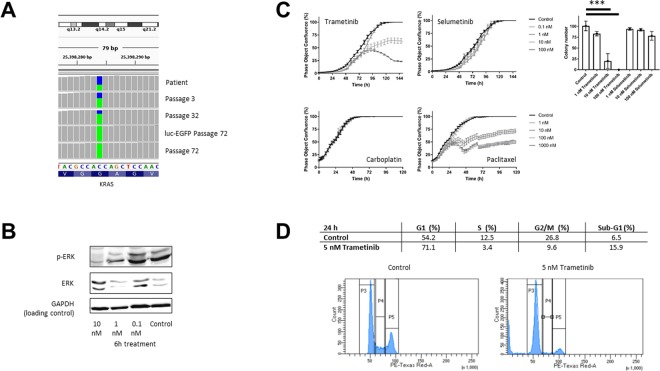
Figure 3.
In vitro effect of trametinib on KRAS mutated PM-PDX-derived cells. (A) KRAS c.35 G > T (p.(Gly12Val)) mutation analysis at patient material, different in vitro passages of the PM-LGSOC-01 cell line (3, 32 and 72) and for the luc-EGFP positive PM-LGSOC-01 cells. The colors blue and green indicate the fraction wildtype versus mutant, respectively. This image was created by third author J. Van der Meulen using the visualization tool Integrative Genomics Viewer (IGV, https://software.broadinstitute.org/software/igv/)37. The complete figure is illustrated in Supplementary Figure S4. (B) Immunoblotting results for p-ERK and ERK of the PM-LGSOC-01 cell line treated with 0.1% DMSO (control) and trametinib at a concentration of 0.1, 1 and 10 nM for 6 hours. GAPDH was used as the loading control (Supplementary Figure S3). (C) On the left, real-time analysis of PM-PDX-derived cell confluency using IncuCyte technology. PM-LGSOC-01 cells were treated with 0.1% DMSO (control), trametinib, selumetinib, carboplatin and paclitaxel at concentrations of 0.1, 1, 10, 100 and 1000 nM. Mean ± SEM of at least four technical replicates is shown. On the right, results on the clonogenicity assay. PM-LGSOC-01 cells were treated for 1 week with trametinib or selumetinib at a concentration of 1, 10 and 100 nM. Mean ± SEM of three technical replicates is shown. Statistical analysis was performed using one-way ANOVA at the α = 0.05 significance level. (D) Results of the cell cycle distribution analysis by flow cytometry. Quantitation of the sub-population fractions of the histograms. PM-LGSOC-01 cells were treated for 24 hours with 0.1% DMSO (control) or 5 nM trametinib. Many cells were blocked in the G0/G1 phase and a reduction in the S and G2/M phase was observed with increasing concentration of trametinib.

