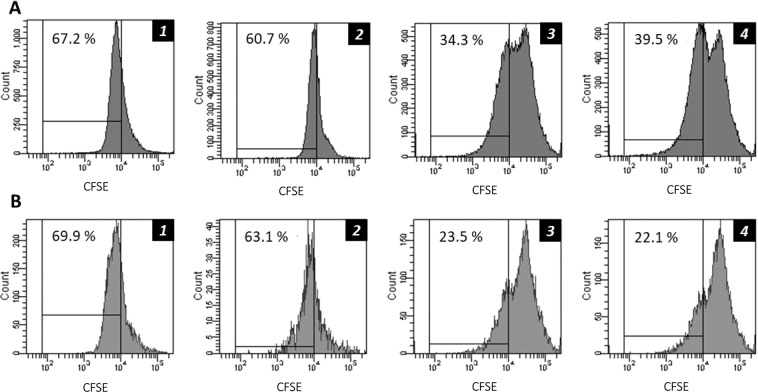
Figure 2.
In vivo suppression of T cell proliferation in male mice following a daily subcutaneous injection (for 7 days) of either (1) Normal Saline, (2) Empty PLGA NPs, (3) Prograf, or (4) TAC-loaded PLGA NPs. Flow cytometry analysis was conducted on two cell groups: (A) CD4+ T cells and (B) CD8+ T cells (n = 6). The percentage of proliferating T cells is presented next to each gate. All samples are composed of the same number of acquired events (106 cells).

