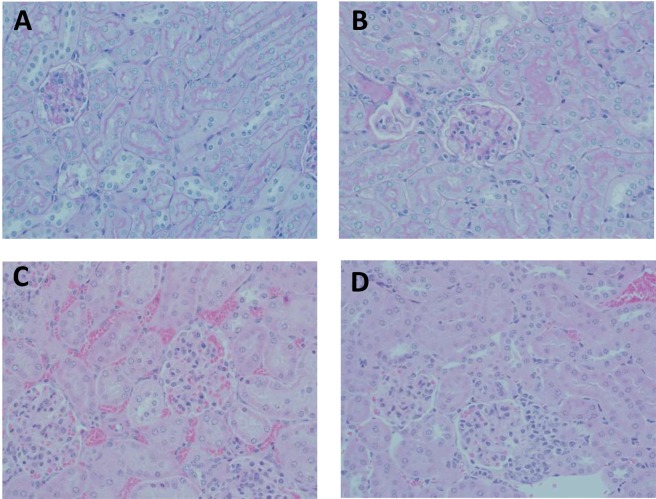
Figure 3.
Histopathology of mice kidney from different treatment groups (n = 6): (A) Normal Saline group: shows normal histology; (B) Empty PLGA NPs group: mild distension of the renal glomerulus capsular space and minimal interstitial oedema; (C) Prograf group: high glomerular congestion and oedema along with renal tubular infiltration (D) TAC-loaded PLGA NPs group: glomerular congestion and oedema along with renal tubular infiltration.

