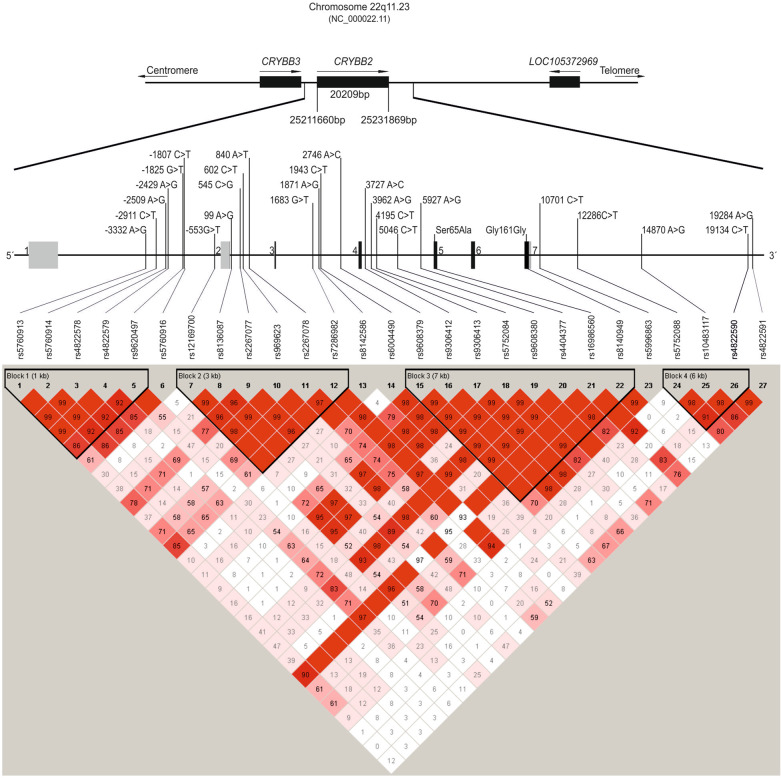
Fig. 1. CRYBB2 gene region and investigated SNPs.
Overview of the CRYBB2 gene region, CRYBB2 intron/exon structure and localization of the 27 investigated SNPs. Linkage Disequilibrium (LD) of the 27 SNPs is presented based on the genotypes of the combined group. Regions of high LD (D’ = 1 and LOD > 2) are shown in bright red; decreasing color intensity indicates decreasing D’-value. Regions of low LD and low LOD scores (D’ < 0.2, LOD < 2) are shown in white.

