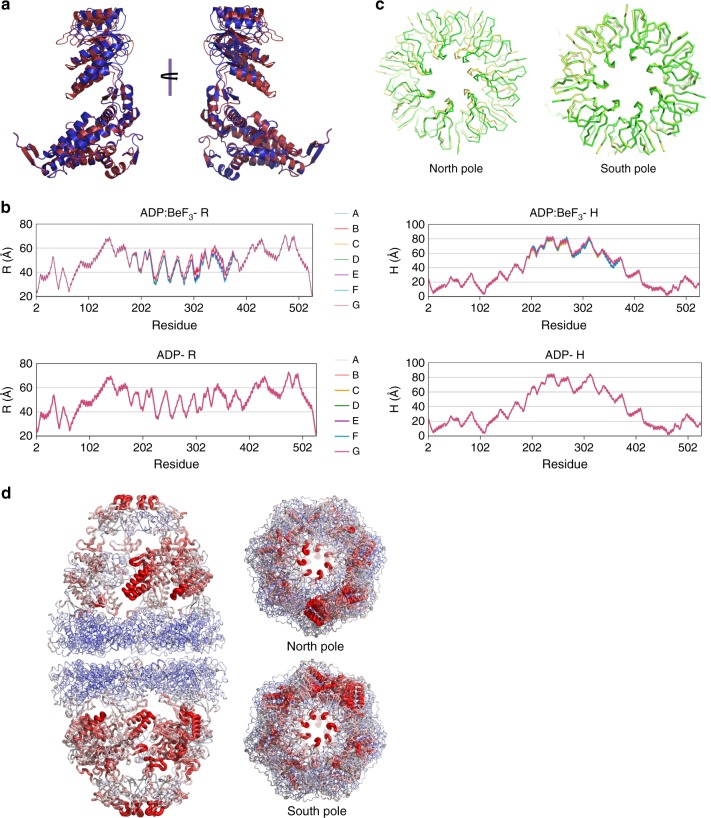
Fig. 3. Transition from the ATP ground-state mimic to ADP football.
a Superposition of the two most conformationally divergent mHsp60 subunits from the ADP:BeF3-bound football complex shows significant backbone conformational asymmetry. The two perspectives depicted are related by 180° rotation. b The crystal structure of the ADP:BeF3-bound football complex and the structure of the ADP-bound football complex built from the C1 cryo-EM map were subjected to a conformational analysis using a cylindrical coordinate system previously employed to analyze the conformation of individual subunits in GroEL36,37. In this analysis, R is the distance between the Cα of a given residue and the sevenfold symmetry axis, whereas H is defined as the height of the Cα of a given residue over the twofold plane of symmetry between two rings. Each trace represents one mHsp60 subunit within the same ring. From top to bottom: ADP:BeF3–R: radial distance to the longitudinal axis for the ADP:BeF3-bound football complex crystal structure; ADP–R: radial distance for the ADP-bound football complex C1 cryo-EM structure; ADP:BeF3–H: height from the equator of the complex for the ADP:BeF3-bound football complex crystal structure; ADP–H: height from the equator for the ADP-bound football complex C1 cryo-EM structure. c Top views of superposed ADP:BeF3 and ADP footballs in green and yellow, respectively. The north equatorial domains of mHsp60 were the templates for superposition. The rotation of the mHsp10 lid is clearly seen in the north pole, while in the south pole the structures coincide with little deviation. d B-factor analysis of the ground-state ADP:BeF3 crystal structure football complex. B factors are depicted by color and thickness of the worm representation. Blue and thin indicates low values while red and thick indicates high values, respectively. Side, south, and north pole views are shown.

