Figure 5.
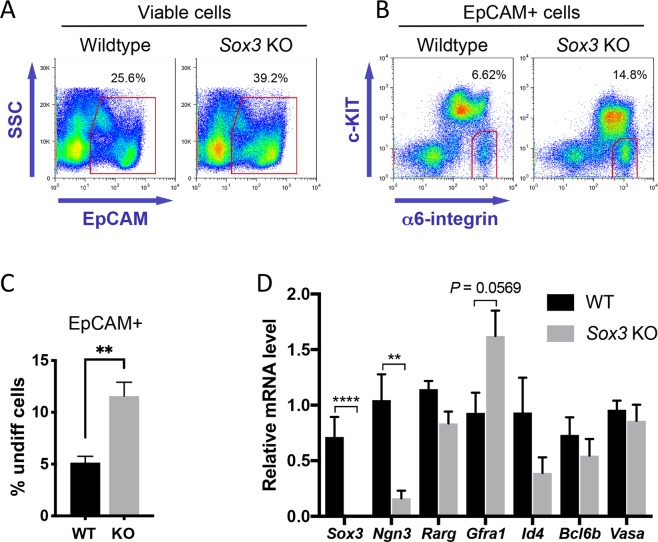
Isolation and analysis of Sox3 null adult undifferentiated spermatogonia. (A,B) Flow-sorting strategy for isolation of undifferentiated spermatogonia (EpCAM + c-KIT– α6-integrin+) for gene expression analysis. Percentages of cells within gates are indicated. (C) Graph shows percentage of EpCAM+ germ cells within c-KIT– α6-integrin+ undifferentiated cell gate from flow cytometry analysis of wildtype and Sox3 null adult testis of A and B. Mean values ± s.e.m. are shown (n = 5 wildtype and n = 6 Sox3 null mice). Significance was determined by two-tailed unpaired t-test, P < 0.01 (**). (D) RT-qPCR analysis of sorted undifferentiated spermatogonia (EpCAM + c-KIT– α6-integrin+) from wildtype and Sox3 null adult testis. Expression levels are corrected to β-actin and normalized to a control sample. Mean values ± s.e.m. shown (n = 5 wildtype and n = 6 Sox3 null mice). Significance was determined by two-tailed unpaired t-test and selected P values are indicated, P < 0.01 (**), P < 0.0001 (****).

